Need for More Speed: Profiling and Optimizing the pbrt Build
Ever since Aras Pranckevičius’s blog post about adding support to clang to emit profiling information, I’ve had that on my list of things to try out—the idea is that if you can understand where the compiler is spending most of its time, then you have the ability to improve the performance of your build by fixing up inefficiencies (addressing expensive or unnecessary #includes, etc.) I recently found the time to spend a few fun hours with Aras’s creation, and as always seems to happen with profiling and optimization, I learned all sorts of new things along the way.
Naturally, I used pbrt for my explorations. We’ve been doing early work for the next edition of Physically Based Rendering, and so there’s a pbrt-v4 branch with candidate implementations of various new algorithms. I had a vague sense that build times were only getting slower, so I started out with a quick check to see where things stood: it turns out that with pbrt-v3, it takes a total of 98s of CPU time to build the core pbrt library on my system. pbrt-v4 took 144s—ouch.
That 1.5x slower is not for any good reason: the new version is better in many ways, but it’s gotten simpler as much as it’s become more capable. All in all, it’s roughly the same number of lines of code.
I had a few theories: the new version uses the C++ standard library more
liberally than the old version, and it makes some use of
abseil classes, mostly taking drop-ins for new things like
std::span and std::optional that not all C++ compilers support yet.
All of that’s template-heavy, which is usually not good for compile times.
I had also gone to town with a
CRTP-based
implementation of the vector math classes without checking to see
how it affected compile times. Vector math is used throughout the system, so if
getting through that template-crazy header took a long time, it would hurt
build times ubiquitously.
Anyway, although there were plenty of possible culprits for the slowdown,
I didn’t have any data to know for sure. Time to fire up clang with
Aras’s -ftime-trace.
Getting Started: Docker to the Rescue
The version of clang on my Mac doesn’t support -ftime-trace, and I was
a little worried that building a newer clang from source would turn into a
nightmare, mostly around fiddly things like getting it to build its own
version of the standard library and then to look for it in the right place.
Therefore, I turned to docker, our savior for avoiding that sort of
configuration pain and saving me from the risk of messing up my everyday
development system if I tried to bang things into working there.
It turns out that Ubuntu 19.10 ships with clang 9, the latest version,
which includes -ftime-trace, so the following Dockerfile is all that it
took to get up and running:
FROM ubuntu:19.10
RUN apt-get update && apt-get install -y build-essential git cmake curl rsync vim clang
CMD [ "/bin/bash" ]
A docker build and then a docker run, and I had myself a shell on the
running container with my pbrt-v4 source directory mounted—we live in
glorious times.
One thing that I quickly learned was that, at least on OSX, accessing
local directories that are mounted in a docker container is surprisingly
slow—slow like it spends 20 seconds scanning the dependencies after you
type make, which is instantaneous when run locally. At first I tried to
live with it, but I soon learned that it’s not just slow, but it’s also
unpredictable: docker would just go off to hyperspace for 2 seconds now and
again when reading files, leaving my benchmark runs suggesting that it took 2
seconds to parse a short header file. That noise led me down a number of
false paths before I figured out what was going on.
Therefore, for the sake of reproducability and for the sake of not going
insane, I got in the habit of rsyncing from the mounted volume to a local
directory in the container (which lives in RAM). With that, I started
getting useful data.
Starting out Bottom-Up
I started out by looking at the traces for individual source files, chosen more or less at random. My thinking was that I’d see what stuck out and fix it under the assumption that it would probably help elsewhere. I also thought that taking a narrow view at the start would make optimizing easier by giving myself a smaller amount of information to digest.
As a representative example, here’s the JSON trace
file for pbrt-v4’s equivalent of
shapes/triangle.cpp.
If you enter chrome://tracing in the address bar of a Chrome tab and load
it, you get this nice visualization of compile time:
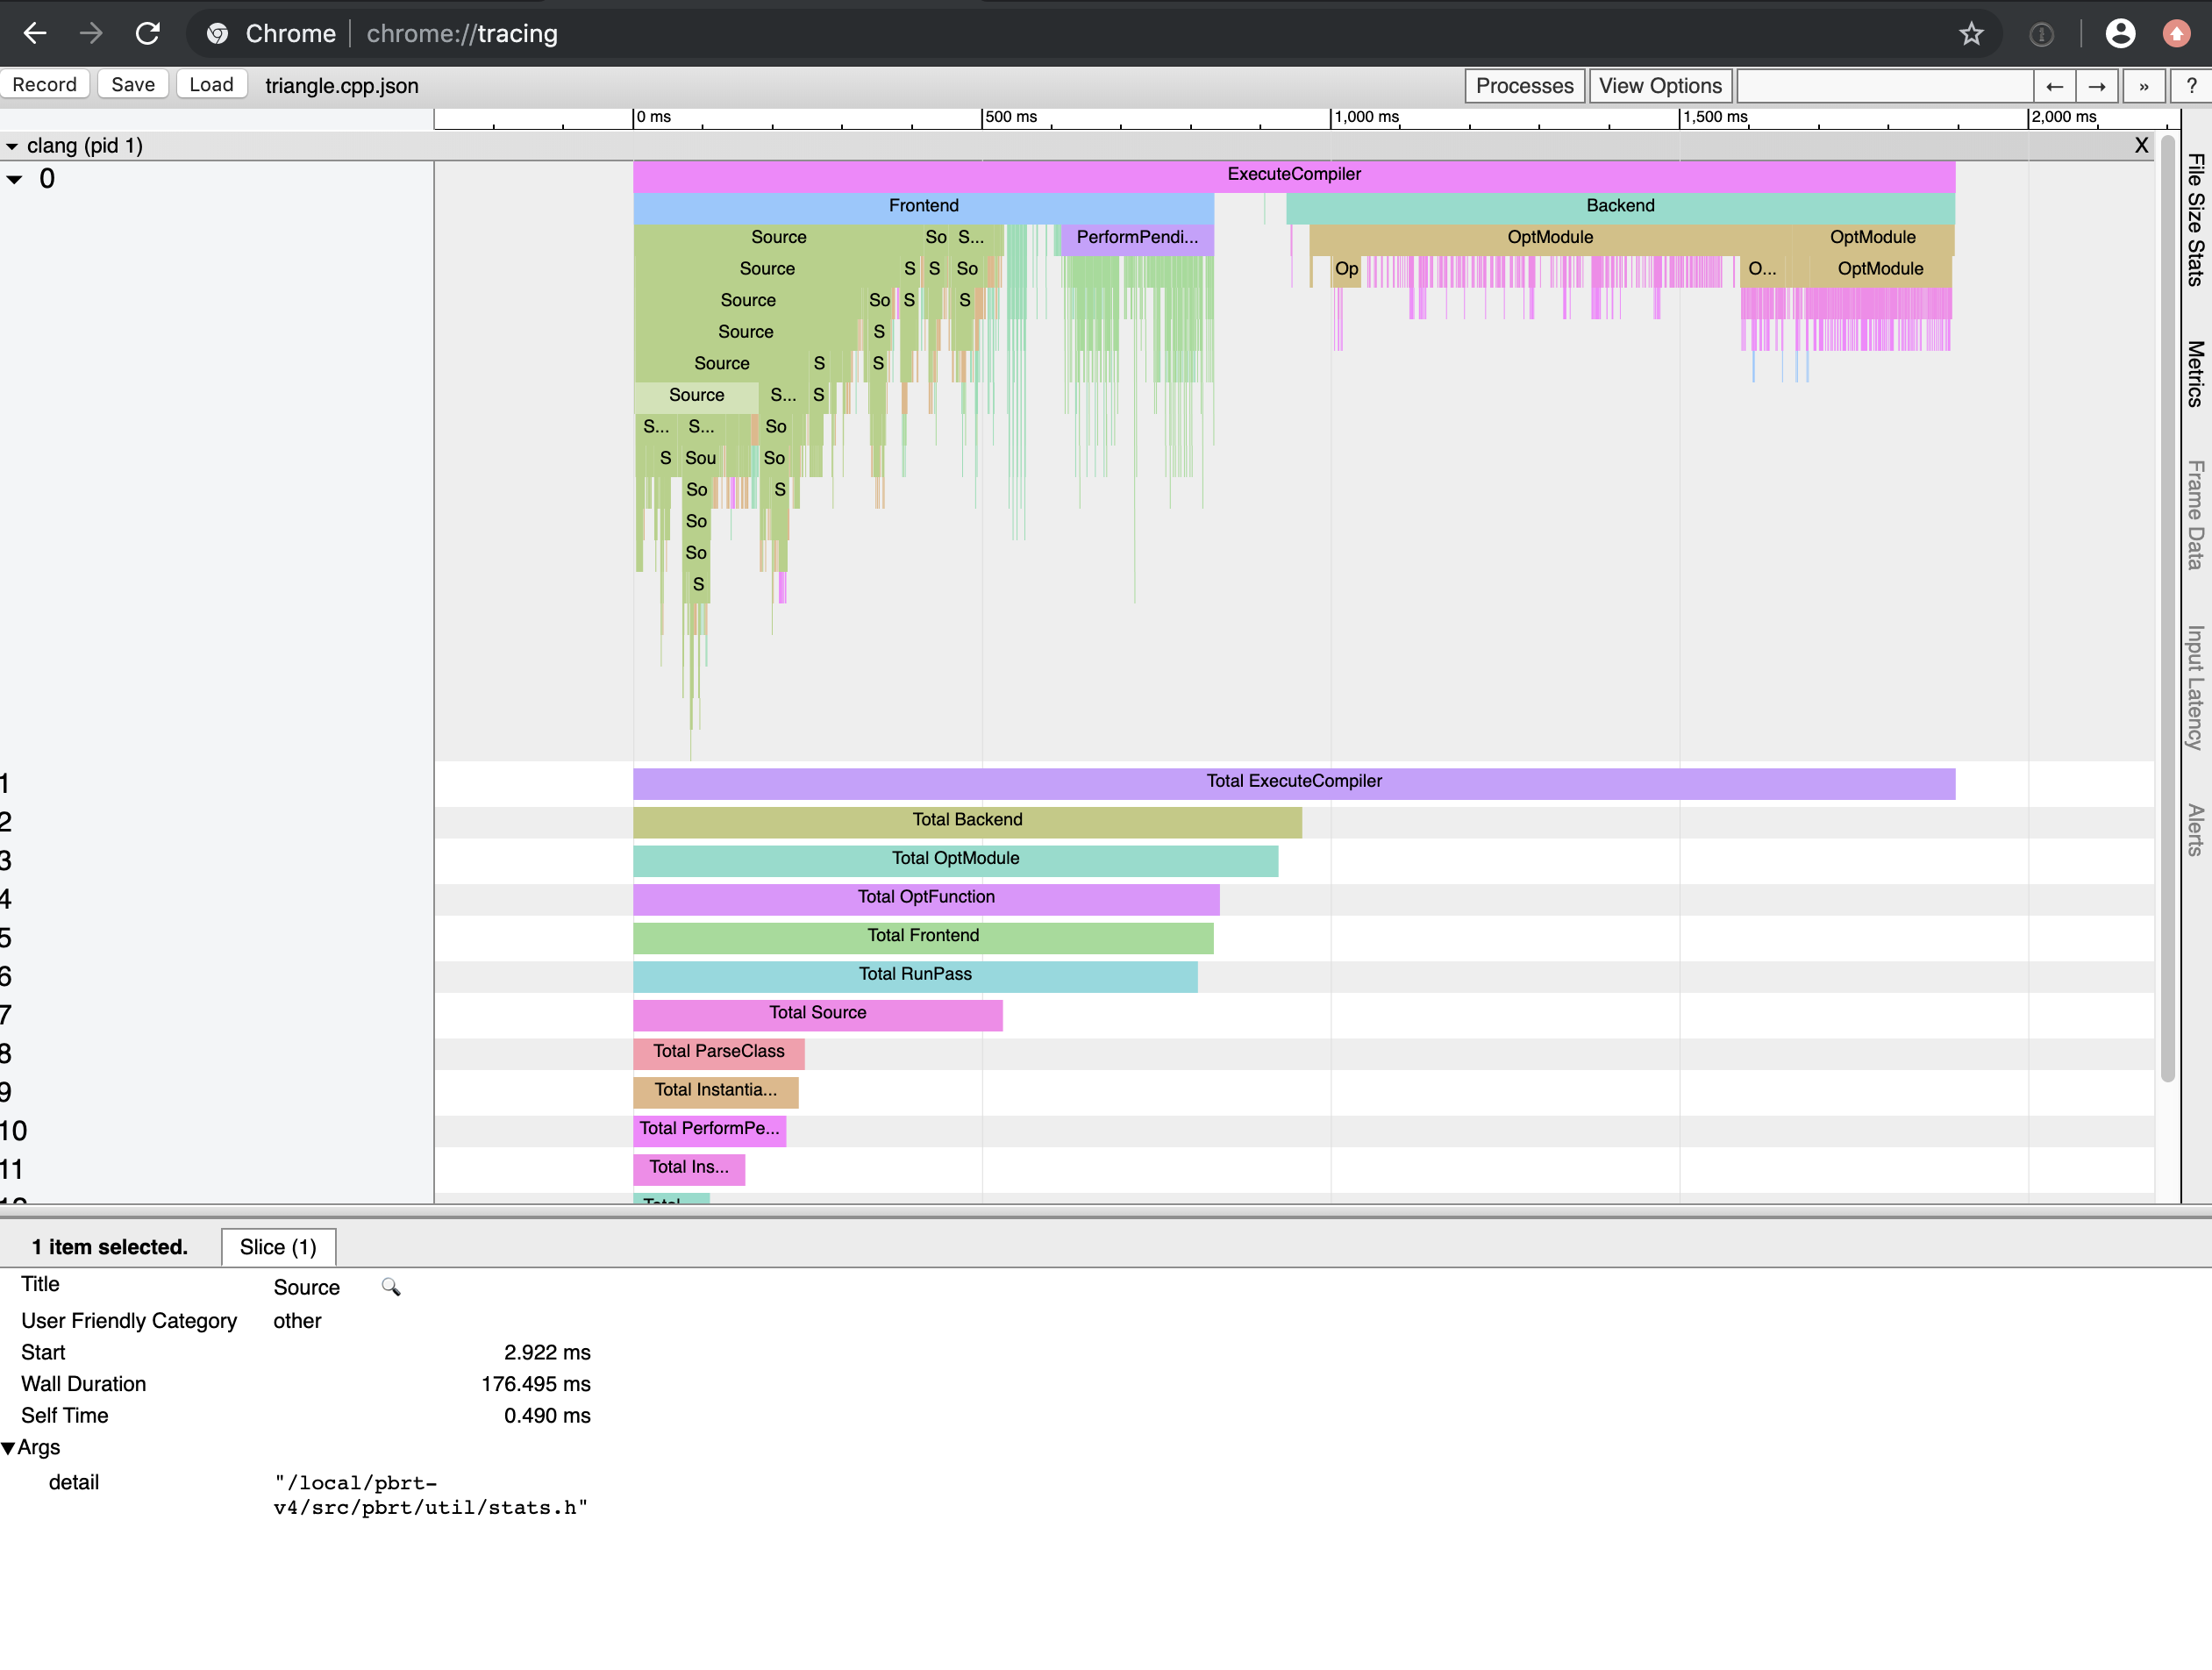 Trace for shapes/triangle.cpp, with the time spent parsing stats.h selected.
It takes about 1900ms of CPU time to compile, roughly evenly split between parsing headers1 and generating code.
I started out by digging into the time spent parsing headers. At first I
had mixed success, in part because it was something of a game of
whack-a-mole. You say to yourself, “How come this header is including
<iostream>? It doesn’t need it, and <iostream> costs 50ms.” Then you
fix that and discover that the build time is unchanged—something else
later in the chain is also including <iostream>, it actually does need
it, and you feel sad. I did pick up a few 2% victories along the way,
tuning up a few widely-#included headers by removing unnecessary #includes,
but I wasn’t making much of a dent in the overall build time.
I did, however, keep noticing that stats.h stuck out: it’s 176.5ms in
that trace there, and most files seemed to end up including it, one way or
another. (Its pbrt-v4 implementation is more or less the same as its
pbrt-v3
equivalent.)
If you drill down into the time spent parsing stats.h, you can see that
almost all of that time is spent parsing four standard library headers:
<algorithm>, <functional>, <map>, and <vector>. I found that I
could eliminate all of them:
<algorithm>was only used for a single call tostd::minand a single call tostd::max, which I replaced with ternary operators.<functional>, the slowest of the lot, wasn’t actually necessary: for the stats system’s usage, raw function pointers were fine and the generality ofstd::functionwasn’t necessary.<map>was used for a few private member variables inStatsAccumulator. I ended up forward declaring aStatsAccumulatorDataclass in the header, storing a pointer to it inStatsAccumulator, and then defining it instats.cppso that<map>only had to be #included there.<vector>was only used for aprivate staticmember variable. I instead declared it as a filestaticvariable instats.cpp.
That brought stats.h down to 10.9ms to parse and gave a nice 15% speedup
in pbrt’s overall build time—finally some solid progress.
Top-Down FTW
It was nice to finally have a clear victory, but performance still hadn’t caught up to pbrt-v3, which was annoying, since it’s never had the build profiling treatment in the first place. I decided to switch tack and look at where time was being spent overall.
Aras has also written a nice tool to aggregate the build profiling information, ClangBuildAnalyzer. Here’s the summary it gave for the version of the system I started with:
Compilation (143 times):
  Parsing (frontend):           92.8 s
  Codegen & opts (backend):     51.3 s
And here’s what it had to say about where things stood after I committed my
stats.h fix:
Compilation (144 times):
  Parsing (frontend):           74.2 s
  Codegen & opts (backend):     46.4 s
Thus, with the improvements I had made so far, I was at a 1.19x speedup.
Now, there’s something really stinky in those numbers—both before and
after. There was a hint of it in shapes/triangle.cpp trace. It’s more
clear in the trace for filters/sinc.cpp, which is also very similar to
the sinc.cpp in
pbrt-v3.
Here’s its trace file.
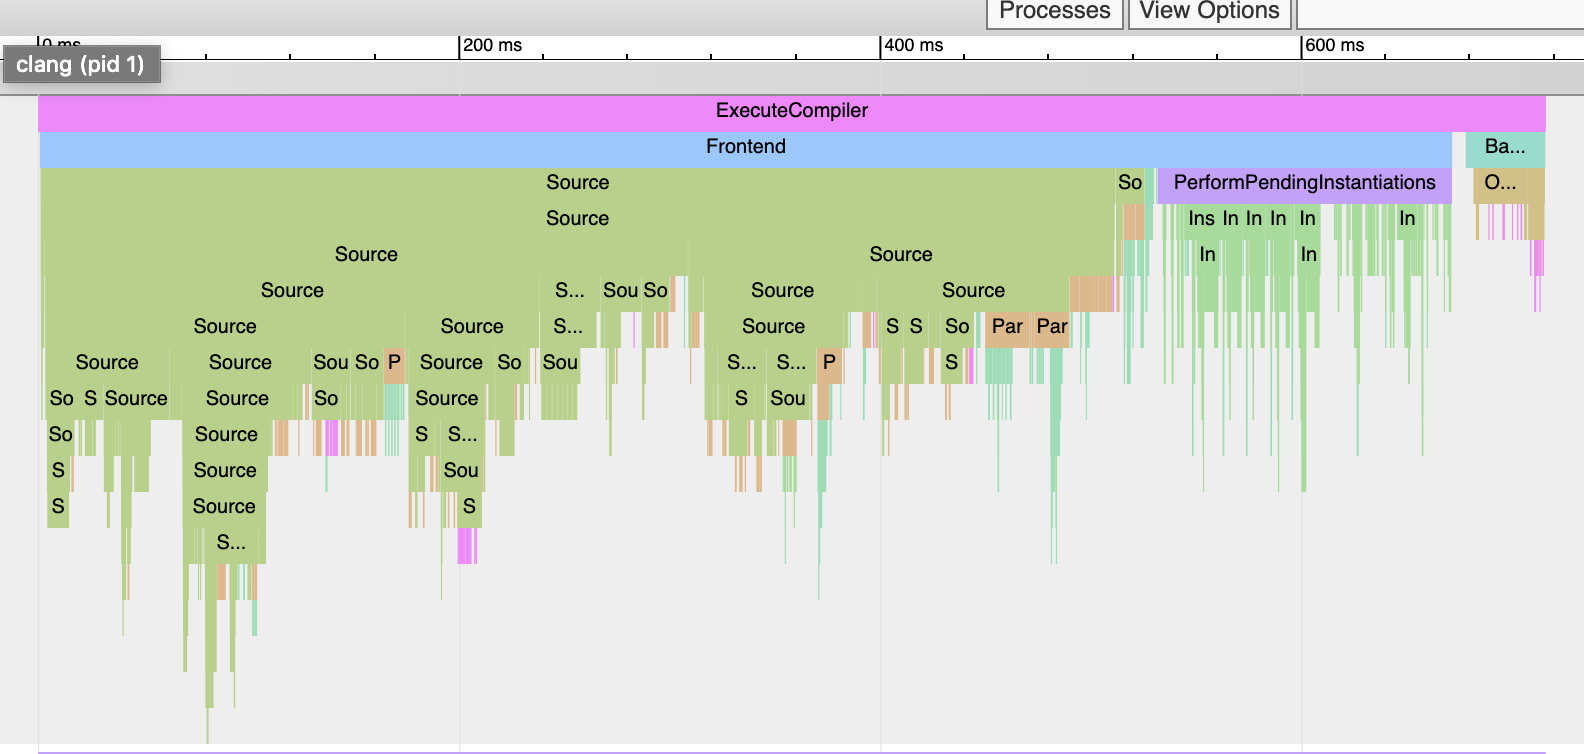 Trace for filters/sinc.cpp, wherein there's so little backend time that
there's only space for "Ba..." in the diagram (upper right teal green box).
Trace for filters/sinc.cpp, wherein there's so little backend time that
there's only space for "Ba..." in the diagram (upper right teal green box).
That’s 750ms to compile it, of which only 38ms were actually generating and optimizing code.
The stinkiness is the ratio between frontend and backend time. It was
especially egregious for filters/sinc.cpp, but looking at the summary
results, we can see that the compiler was spending nearly 2x as much time
just parsing source code as it was on the meat and potatoes of code
generation and optimization. I didn’t digest how bad that was until I saw
it in the aggregate statistics: before I got started looking at data, I’d
always assumed that, even with all the grunginess of parsing C++, code
generation and optimization time would dominate in pbrt builds, especially
when running at -O2.
As I started thinking about what might be the cause of that imbalance, I
thought about the fact that pbrt-v4 had been broken down into smaller
pieces than pbrt-v3: rather than having a big sampling.h file, there
was sampling/warps.h and sampling/geometry.h and
sampling/tabularized.h, and so forth, all with their own *.cpp files.
Thus, there were more source files to compile in the new version:
% find ~/pbrt-v3/src -name \*.cpp | fgrep -v /ext/ | wc -l
     133
% find ~/pbrt-v4/src/pbrt -name \*.cpp | wc -l
     197
The attentive reader will now note that the factor of increase in source
files is roughly equivalent to the factor of observed increase in
compilation time. Although my earlier attempts to make individual headers
more efficient were all good and fine, there’s some inherent amount of
#include-ing that’s necessary to compile any .cpp file, and having more
of them gives you more of that.
This brings us to the same rule that applies with runtime performance optimization: if you want to go faster, you can make the things you’re doing run more efficiently, or you can do less of them. In retrospect, that trade-off in the structure of the system should have been obvious, but the truth is, it wasn’t, at least to me, until I saw the actual data.
With that understanding in hand, I restructured the system into about a
quarter as many *.cpp files: all of the pixel reconstruction filters went
into filters.cpp, and so forth. It’s fewer source files than pbrt-v3,
and few enough that they can all live comfortably in a single directory.
After another benchmarking run, ClangBuildAnalyzer reported:
Compilation (48 times):
  Parsing (frontend):           30.4 s
  Codegen & opts (backend):     39.1 s
Boom! A 2.07x speedup from where we started, with a 3x reduction in time spent in the frontend, and it’s 1.41x faster to build than pbrt-v3. Now we’re talking. On an 8 core system, it’s about ten seconds of wall clock time to build from scratch—I can be happy with that, and lacking further ideas for things to improve, left it there.
Conclusions
-ftime-trace helped deliver a victory, but the battle’s not won yet. In
spite of my trying to avoid the C++ standard library, more than half of the
remaining frontend time is spent parsing standard library headers, which
are full of insanity.2 Take <array>, which you’d think could be
parsed in a jiffy: it’s just a simple wrapper around an array, after all.
Turns out that it costs 85ms, 64ms of which are spent
parsing… <string>, which you get courtesy of <array> #including
<stdexcept>, otherwise known as the header I wish had no reason to exist.
My own array implementation, which does the obvious thing and is enough
to cover the important stuff, parses in 1.3ms.
That lesson goes back at least as far as
EASTL, but it seems that
sometimes one has to learn these lessons for oneself. I hold out hope that
the availability of tools like -ftime-trace that illuminate these issues
will lead to improvements in what ships with compilers.
It was surprising how much fun it was to spend a few hours working on build performance—having good tools made all the difference. One nice thing about optimizing the build is that, unlike with runtime performance optimization, it’s hard to introduce bugs in your system. It either builds and links or it doesn’t; if everything builds successfully, you can be pretty sure your system still works (though you should test it anyway.)
Best of all, build time optimization turns out to have the same dopamine hit as optimizing regular code does—“I made an improvement and it got faster: can I think a bit more and do even better?” It’s fun times, and future you will thank today you for the time you saved by giving the build’s efficiency some attention.
notes
-
I am aware of precompiled headers, but have never tried clang’s implementation. They’ve always seemed treacherous as far as causing confusing errors if you get the dependencies wrong; I’ll use my lingering trauma from the MIPS C++ compiler’s buggy template cache as my excuse for avoiding them. In any case, for this post, I’m going to declare them out-of-bounds. ↩
-
I have no idea why precompiled headers aren’t used out of the box for the system-provided C++ standard library… Unless they are, in which case I’m really scared. ↩