Swallowing the elephant (part 3)
Today we’ll look at two more places where pbrt was spending a lot of time when parsing Disney’s Moana island scene and see what we can do to improve performance there. With those taken care of, we’ll wrap up, at least for now and as far as what’s reasonable to do in pbrt-v3. One last posting in a few days will dig into how much farther we can go if we remove the constraint of not making changes that would make the source code be too different than the system described in Physically Based Rendering.
Optimizing the parser itself
After the performance improvements from last time, the fraction of time spent in pbrt’s parser, already significant at the beginning, naturally went up. By now, it was by far where most time was spent during startup.
I finally bit the bullet and implemented a hand-written tokenizer and parser for pbrt scenes. The pbrt scene file format is fairly easy to parse: quoted strings aside, tokens are separated by white space and the grammar is very straightforward (there’s never a need to look ahead more than one token), but a custom parser was still about a thousand lines of code to write and debug. It helped to have lots of scenes to test with; after fixing the outright crashes, I kept going until everything I had rendered exactly the same images as before: there’s no excuse for any sort of pixel difference solely from swapping out the parser. At that point, I was as confident as I could be that I had it right.
I did my best to keep the new version efficient, mmap()ing input files
when possible and using a re-implementation of C++17’s
std::string_view
to minimize making copies of strings from the file’s contents. Also, because
strtod() had consumed a lot of time in earlier traces, I wrote a
parseNumber()
function
with some care: single-digit integers and regular integers are handled
separately, and strtof() is used rather than strtod() in the common
case when pbrt is compiled to use 32-bit floats.1
Throughout the implementation of the new parser, I was a little worried that the old parser would be faster: after all, flex and bison have seen years of development and optimization. There was no way to know if all the time I’d spent on writing a new one had been wasted until it was finished and working correctly.
To my relief, the custom parser was a big win: flex and bison’s generality brought along enough of a performance cost that the new version could handily beat them. With the new parser, startup time dropped to 13m 21s, an incremental 1.5x speedup! As an added bonus, all of the support for flex and bison could then be removed from pbrt’s build system. All that was always a headache, especially on Windows, where most people don’t have those installed by default.
Graphics state management
With the parser much faster, a new annoyance stuck out: at that point,
roughly 10% of setup time was spent in the pbrtAttributeBegin() and
pbrtAttributeEnd() functions, and most of that time in dynamic memory
allocation and freeing. Back during that first 35 minute run, those
functions used around 3% of the runtime, so weren’t anything to worry
about, but this is how it goes in the optimization business: once you start
knocking down the big things, the smaller things start to matter more.
pbrt’s scene description is based on a hierarchical graphics state, where
there’s a current transformation, a current material, and so forth, and
where you can snapshot the current state (pbrtAttributeBegin()), make
some changes to it before adding some shapes to the scene, and then pop
back to the original state (pbrtAttributeEnd()).
The graphics state is stored in a structure named… wait for
it… GraphicsState. A std::vector is used to store copies of
GraphicsState objects for the stack of saved graphics states. Looking at
GraphicsState’s members suggested something to worry about—three
std::maps from names to instances of textures and materials:
struct GraphicsState {
    // ...
    std::map<std::string, std::shared_ptr<Texture<Float>>> floatTextures;
    std::map<std::string, std::shared_ptr<Texture<Spectrum>>> spectrumTextures;
    std::map<std::string, std::shared_ptr<MaterialInstance>> namedMaterials;
};
Examining the scene files, I found that most instances of saving and restoring graphics state were along these lines:
AttributeBegin
    ConcatTransform [0.981262 0.133695 -0.138749 0.000000 -0.067901 0.913846 0.400343 0.000000 0.180319 -0.383420 0.905800 0.000000 11.095301 18.852249 9.481399 1.000000]
    ObjectInstance "archivebaycedar0001_mod"
AttributeEnd
In other words: update the current transformation and instantiate an object
instance; no changes were made to the contents of any of those
std::maps. Making a complete copy of them—allocating red-black tree
nodes, incrementing shared pointer reference counts, allocating space for
and copying strings—was almost always a waste, with all of that being
freed, unaccessed, when the previous graphics
state was restored.
I replaced each of those maps with a std::shared_ptr to a map and
implemented a copy-on-write approach, where a copy is made inside an
attribute begin/end block only if their contents need to be modified. The
change
wasn’t too complicated, but it reduced startup time by just over a minute,
getting us to 12m 20s of processing before rendering began—an incremental
speedup of 1.08x.
What about rendering time?
The attentive reader will note that I haven’t said anything at all about rendering time so far. To my surprise, it’s been fairly tolerable out of the box: pbrt can render film-resolution images of the scene with a few hundred samples per pixel in two to three hours using twelve cores. For example, this image, one of the slower ones, renders in 2h 51m 36s:
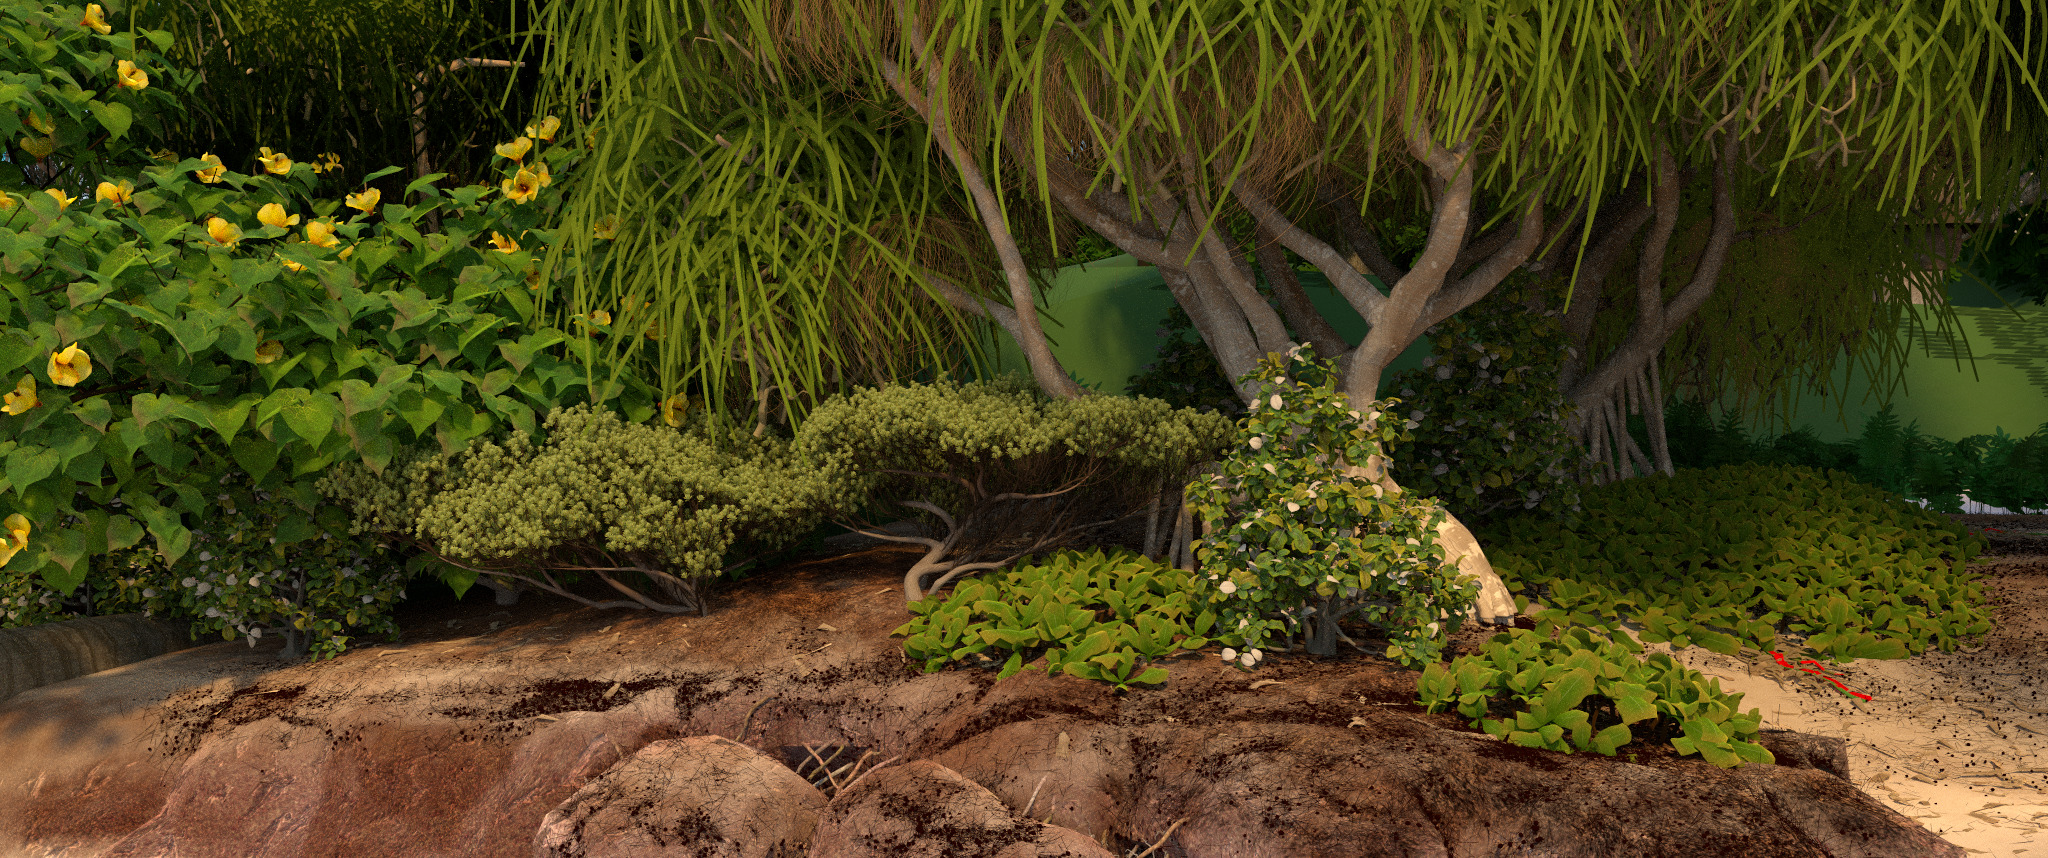 Moana
island dunes rendered with pbrt-v3 at 2048x858 resolution
with 256 samples per pixel. Total rendering time using a 12 core / 24
thread Google Compute Engine instance running at 2 GHz with the latest
version of pbrt-v3 was 2h 51m 36s.
Moana
island dunes rendered with pbrt-v3 at 2048x858 resolution
with 256 samples per pixel. Total rendering time using a 12 core / 24
thread Google Compute Engine instance running at 2 GHz with the latest
version of pbrt-v3 was 2h 51m 36s.
That seems surprisingly reasonable to me. I’m sure there’s room for improvement and that a closer look at where time is being spent would reveal plenty of “interesting” things, but it hasn’t yet been compelling to dig into that.
Looking at the profile, roughly 60% of rendering time is spent in ray–object intersections (most of it in BVH traversal), and 25% is spent in ptex texture lookups. Those percentages are similar to what they are in simpler scenes, so there’s nothing immediately obviously broken there. (Though I’m sure that Embree could trace those rays in a bit less time.)
Parallel scalability is not great, unfortunately. I’m generally seeing around 1400% CPU usage for rendering, compared to the 2400% ideal (on 24 virtual CPUs with Google Compute Engine). The issue seems to be lock contention in ptex, but I haven’t dug into that further. A likely contributor to that is that pbrt-v3 doesn’t compute ray differentials for indirect rays in the path tracer; in turn, those rays will always access the most detailed texture MIP level, which is not very friendly to texture caching.
Conclusion (w.r.t. pbrt-v3)
After fixing up graphics state management, I hit the point where it wasn’t obvious how to make further progress without making substantial changes to the system; nothing was left that both took a lot of time and hadn’t yet seen attention for optimization. Therefore, we’ll stop here, at least as far as pbrt-v3 goes.
Overall, it was good progress: from 35 minutes to 12m 20s of startup time
before rendering, a 2.83x speedup overall. Further, memory use was reduced
from 80 GB to 69 GB by being smarter about the transformation cache. All of
that is available now if you sync to the latest version of pbrt-v3 (or if
you have done so in the past few months.) And we’ve come to understand
what a mess Primitive memory is for this scene; we figured out how to
save another 18 GB of memory, though didn’t implement that in pbrt-v3.
Here is where those 12m 20s at startup is spent after all of these optimizations:
| Function / operation | Percent of runtime |
|---|---|
| BVH construction | 34% |
Parsing (ex. strtof()) |
21% |
strtof() |
20% |
| Transform cache | 7% |
| Reading PLY files | 6% |
| Dynamic memory allocation | 5% |
| Inverting transformations | 2% |
| Graphics state management | 2% |
| Other | 3% |
Multi-threading more of the startup phase would probably be the best option to improve performance from there: almost everything during scene parsing is single-threaded; BVH construction is a natural candidate. It also might be interesting to peel off things like PLY file reading and BVH generation for individual object instances and run them asynchronously in the background while allowing parsing to proceed in the main thread.
At some point I’ll look into whether there are faster strtof()
implementations; pbrt just uses whatever the system provides. I am wary
about replacing that with something that’s not super well tested, however;
parsing floats is one of those things that you really want to trust
will always just work so you don’t have to worry about it.
Further reducing the load on the parser is also appealing: we still have 17 GB of text input files to parse. We could support a binary encoding of pbrt input files (possibly along the lines of RenderMan’s approach), though I have mixed feelings about the idea; being able to open up scene description files in a text editor and edit away is quite useful, and I worry that sometimes using a binary encoding would end up being confusing to students using pbrt in classes. This is probably one of those places where the right decision for pbrt is probably different than the right decision for an industrial-grade commercial renderer.
It was a fun adventure to chase down all of these optimizations and to better understand how various design decisions in pbrt turned out to have unexpected implications with a scene of this complexity. All this is a great example of how useful it is to have a true production-complexity scene available to the general rendering community; huge thanks again to Disney for taking the time to put this scene together and make it available to everyone.
For our next installment, we’ll look at a few things that further improve performance if we allow more radical changes to pbrt.
note
-
On the Linux system I tested on,
strtof()is no faster thanstrtod(). On OS X, remarkably,strtod()is about twice as fast, which makes no sense at all. I left my usage ofstrtof()as is purely on hard-headed principle. ↩