Swallowing the elephant (part 1)
Walt Disney Animation Studios (WDAS) has just given the rendering research community an incredible gift with their release of the full scene description for the island from Moana. Between geometry and textures, it’s just over 70 GB of data on disk for a single frame, making it a stellar example of the degree of complexity that production rendering deals with today; never before have rendering researchers and developers outside of film studios been able to work with realistic production scenes like this.
Here’s a rendering of it with today’s pbrt:
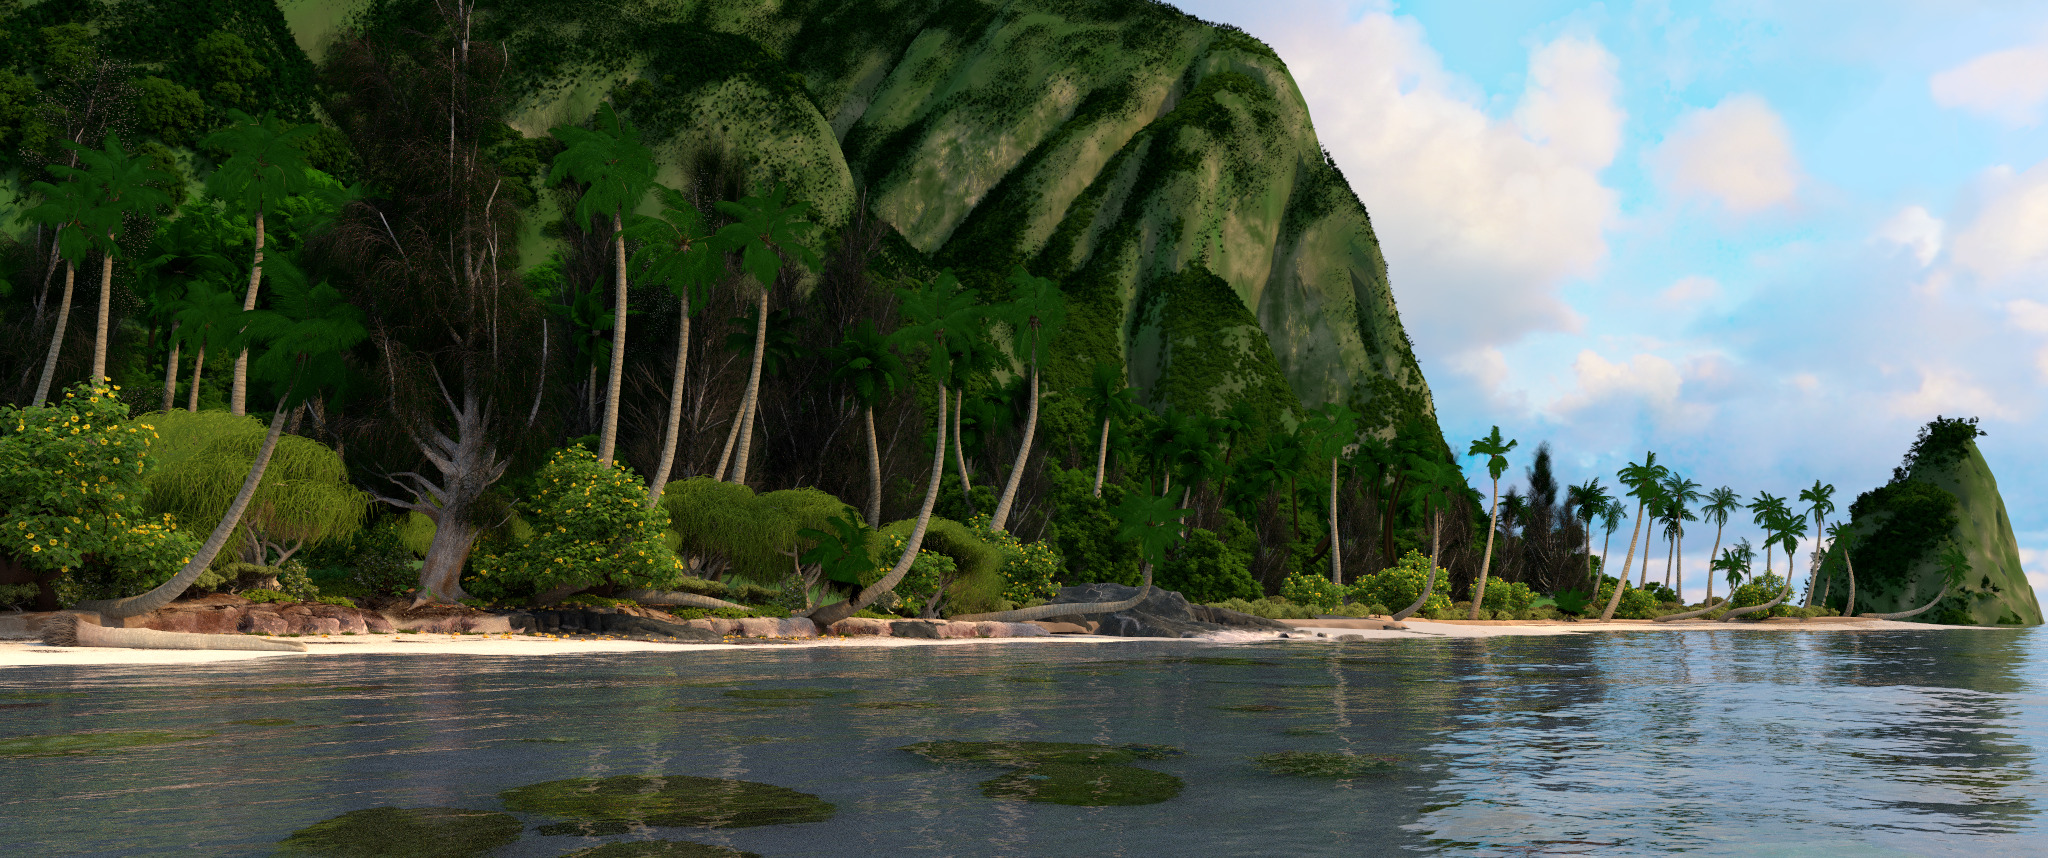 Moana
island rendered with pbrt-v3 at 2048x858 resolution
with 256 samples per pixel. Total rendering time using a 12 core / 24
thread Google Compute Engine instance running at 2 GHz with the latest
version of pbrt-v3 was 1h 44m 45s.
Moana
island rendered with pbrt-v3 at 2048x858 resolution
with 256 samples per pixel. Total rendering time using a 12 core / 24
thread Google Compute Engine instance running at 2 GHz with the latest
version of pbrt-v3 was 1h 44m 45s.
It was a huge amount of work on Disney’s side to extract the scene from their internal scene representation and convert it to a format that’s generally accessible; major props to them for taking the time to package and prepare this data for widespread use. I’m confident that their work to do this will be well repaid in the future as researchers use this scene to dig into the issues related to efficiently rendering scenes of this complexity.
This scene has already taught me a lot and has made pbrt a better renderer, but before we get into that, first a little story for context.
The hash table that wasn’t
Years ago while interning in the rendering group at Pixar, I learned an important lesson: “interesting” things almost always come to light when a software system is given input with significantly different characteristics than it’s seen before. Even for well-written and mature software systems, new types of input almost always expose heretofore unknown shortcomings in the existing implementation.
I first learned this lesson while Toy Story 2 was in production. At some point, someone noticed that a surprising amount of time was being spent parsing the RIB scene description files. Someone else in the rendering group (I believe it was Craig Kolb) whipped out the profiler and started digging in.
It turned out that most of the parsing time was spent doing lookups in a hash table that was used to intern strings. The hash table was a small fixed size, perhaps 256 elements, and it used chaining when multiple values hashed to the same cell. Much time had passed since the hash table was first implemented and scenes now had tens of thousands of objects, so naturally such a small hash table would quickly fill and become ineffective.
The expedient thing to do was to just make the hash table larger—all this was happening in the thick of production, so there was no time to do something fancy like make the hash table grow as it filled up. One line change, rebuild and do a quick test before committing, and… no performance improvement whatsoever. Just as much time was being spent on hash table lookups. Fascinating!
Upon further digging, it was discovered that the hash function that was being used was the equivalent of:
int hash(const char *str) {
    return str[0];
}
(Forgive me Pixar, if I’ve posted super-secret RenderMan source code there.)
The “hash” function had been implemented in the 1980s, at which time someone had apparently decided that the computational expense of actually incorporating some contribution from all of the characters in the string in the hash value wasn’t worth it. (And if you’ve only got a handful of objects in the scene and a 256 entry hash table, maybe, I guess.)
Another historic implementation detail added insult to injury: once Pixar started making movies, the names for objects in scenes had grown fairly long, along the lines of “BuzzLightyear/LeftArm/Hand/IndexFinger/Knuckle2”. However, some earlier phase of the production pipeline used a fixed-size buffer for storing object names and would shorten any longer names, keeping only the end and helpfully adding a few periods to show that something had been lost: “…year/LeftArm/Hand/IndexFinger/Knuckle2”.
Thence, all of the object names the renderer saw were of that form, the hash function hashed all of them to the bucket for ‘.’, and the hash table was actually a big linked list. Good times. At least the fix was simple once all that was figured out.
An intriguing invitation
That lesson came to mind last year when Heather Pritchett and Rasmus Tamstorf from WDAS reached out to me and asked if I was interested in helping make sure that the Moana scene would render reasonably well with pbrt.1 Naturally I said yes. I was delighted to help out and curious to see how it’d go.
The foolish optimist in me was hopeful that there wouldn’t be any huge surprises—after all, pbrt was first released around 15 years ago and many people have used it and studied the code over the years. It should be safe to assume there weren’t any embarrassments like RenderMan’s old hash function, right?
Of course, the answer is “wrong”. (And that’s why we’re here today, and for a few more posts after this one.) While I was a little disappointed that pbrt wasn’t awesome out of the box, I think that my experience working with the Moana scene is a first validation of the value of having this scene available; pbrt is already a better system from my having dug into how it performed with it.
First renderings
I immediately downloaded the scene once I had access to it (waiting a few hours for it to make its way over my home Internet connection) and untarred it, giving me 29 GB of pbrt files and 38 GB of ptex texture maps2. I threw caution into the wind, and tried to render it on my home system (feat. 16 GB of RAM and a 4 core CPU). I came back a little while later to find the computer unresponsive, all of the RAM used, and pbrt still trying to finish parsing the scene description. The OS was doing its best to make it happen with virtual memory, but it seemed hopeless. After killing the job, it was still about a minute before the system was responsive again.
Next up was a Google Compute Engine instance, allowing for more RAM (120 GB) and more CPUs (32 threads on 16 CPUs). The good news is that pbrt could successfully render the scene (thanks to Heather and Rasmus’s efforts to get it into pbrt’s format). Seeing that pbrt could generate reasonable pixels for feature film content was thrilling, but the performance was something else: 34m 58s just to parse the scene description, with memory use upward of 70 GB during rendering.
Now, it was 29 GB of pbrt scene description files on disk to parse and turn into something that could be rendered, so I wasn’t expecting a ten second startup phase. But half an hour before rays start being traced? That’s bad enough to make it fairly difficult to work with the scene at all.
One good thing about seeing that sort of performance is that it seemed very likely that there’s some really stinky stuff going on; not just “matrix inversion could be made 10% faster”, but “oops, we’re walking through a 100,000 element linked list”. I was optimistic that it’d be possible to chop that down significantly once I understood what was happening.
No help from the statistics
The first place I looked for insight was the statistics that pbrt dumps out after rendering. pbrt’s major phases of execution are instrumented so that rough profiling data can be gathered by recording what’s actually running at periodic interrupts during rendering. Unfortunately, the statistics didn’t explain much: of the nearly 35 minutes before rendering started, 4m 22s was reported to be spent building BVHs, but none of the rest of the time was accounted for in any further detail.
Building BVHs is the only meaningful computational task that happens during scene parsing; everything else is essentially just deserializing shape and material descriptions. Knowing how much time was spent on BVH construction gave a sense of how (in)efficient the system was: what’s left is roughly 30 minutes to parse 29 GB of data, or about 16.5 MB/s. Well-optimized JSON parsers, which perform essentially the same task, seem to run at the rate of 50-200 MB/s, which validates the sense that there’s room for improvement.
To better understand where the time was going, I ran pbrt using the Linux
perf tool, which I’d
never used before, but seemed like it would do the trick. I did have to
instruct it to actually look at the DWARF symbols to get function names
(--call-graph dwarf), and had to dial down the sampling frequency from
the default 4000 samples per second to 100 (-F 100) so I didn’t get 100
GB trace files, but with that, things were lovely, and I was pleasantly
surprised that the perf report tool had a nice curses interface.
Here’s what it had to say after a run with pbrt as it was at the start of all this:
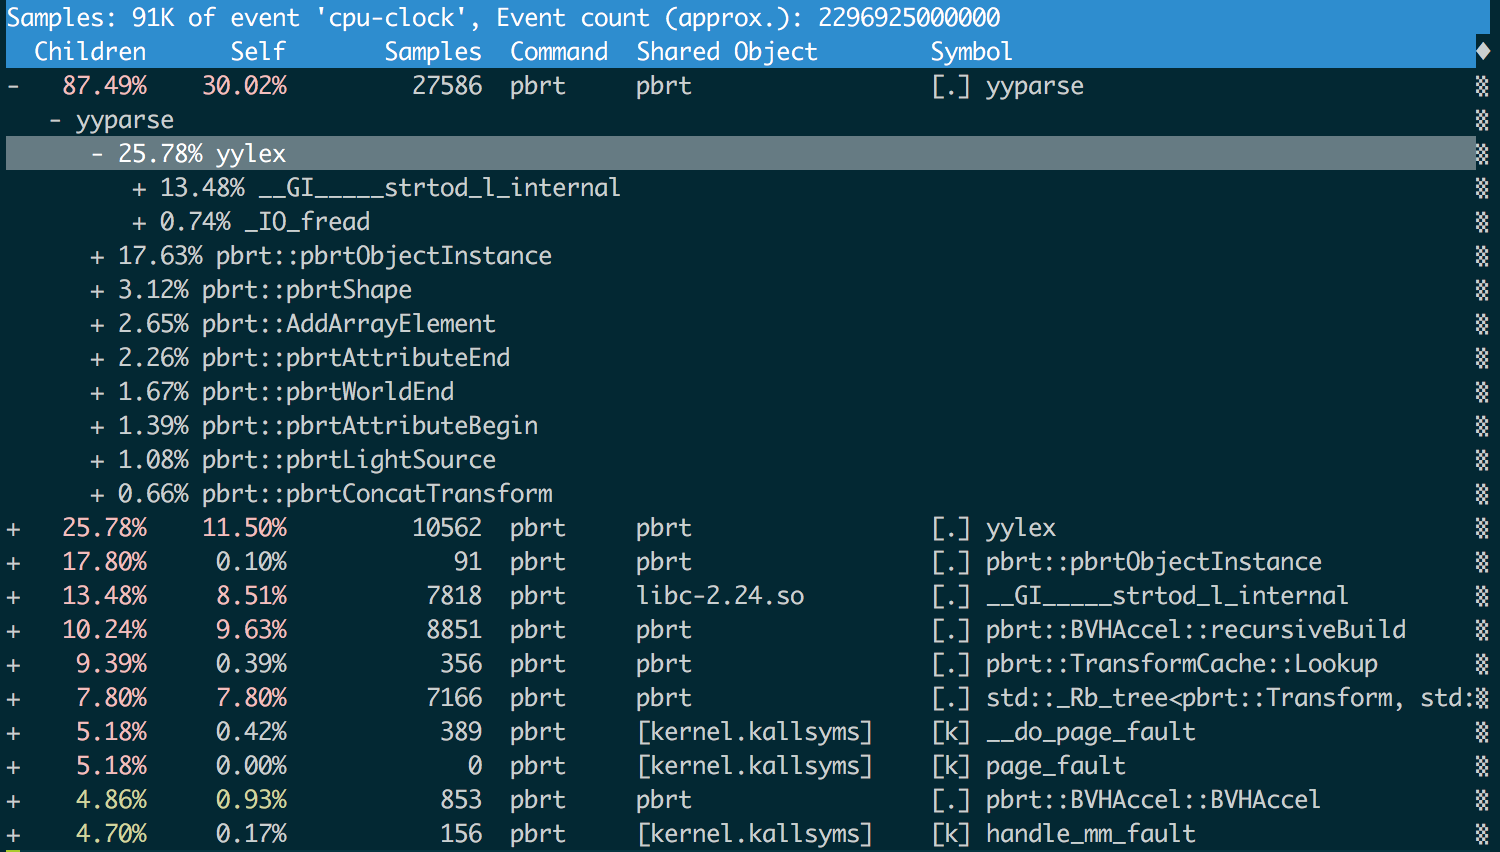 I'm actually serious about “nice curses interface”.
We can see that over half of the time was spent on the mechanics of
parsing: yyparse() is the parser generated by
bison and yylex() is the lexer
generated by flex. Over half of the time
in yylex() was spent in strtod(), which converts strings to doubles.
We’ll hold off on attacking yyparse() and yylex() until the third
posting in this series, but we already have a good indication that
reducing the amount of data we throw at the renderer might be a good idea.
From text to PLY
One way to spend less time parsing a text representation of data is to
convert the data to something more efficient to parse. Quite a bit of
those 29 GB of scene description files is triangle meshes, and pbrt already
had native support for PLY
files, which provide an
efficient binary representation of polygon meshes. pbrt also has a
--toply command-line flag that will parse a pbrt scene description file,
convert any triangle meshes it finds to PLY files, and emit a new pbrt file
that refers to those PLY files instead.
One catch was that the Disney scene makes extensive use of
ptex textures, which in turn require a faceIndex value
to be associated with each triangle, indicating which face of the original
subdivision mesh it came from. It was simple enough to add support for a
custom field in the PLY file to carry these values
through.
Further investigation revealed that turning each and every mesh—even
those with a handful of triangles—into a PLY file led to directories with
tens of thousands of small PLY files, which offered their own performance
challenges; changing the implementation to leave small meshes as
is
took care of that.
For what it’s worth, here’s a little shell
script I used to convert all of the
*_geometry.pbrt files in a directory to use PLY for the larger
meshes. Note that it has a few hard-coded assumptions about paths that need
to be updated for it to work elsewhere.
A first speedup
After converting all the big meshes to PLY, the size of the on-disk representation went from 29 GB to 22 GB: 16.9 GB of pbrt scene files, and 5.1 GB of binary PLY files. After the conversion, overall system startup time was reduced to 27m 35s, a savings of 7m 23s, or a 1.3x speedup.3 Processing a PLY file is much more efficient than a text pbrt file: just 40s of startup time was spent parsing the PLY files, and thus we can see that PLY files are processed at about 130 MB/s, or about 8 times faster than the pbrt text format.
That was a nice easy victory to get us started, but there’s still plenty more to do.
Next time we’ll figure out where all the memory is actually being used, fix a few things there, and pick up bit more performance along the way.
notes
-
The motivations for my adding support for ptex and the Disney BSDF to pbrt last year may be understood better now. ↩
-
All times reported here and in following posts are for the WIP version of the scene I was working with before the official release. It looks like the final version is a bit larger. We’ll stick with the results I recorded when working with the original scene, even if they don’t exactly match what they’d be with its final version. Presumably the lessons are the same. ↩
-
Note that the speedup basically matches what we’d expect based on a ~50% reduction in the amount of data to parse and the amount of time the profiler reported we were spending in basic parsing, which is reassuring. ↩